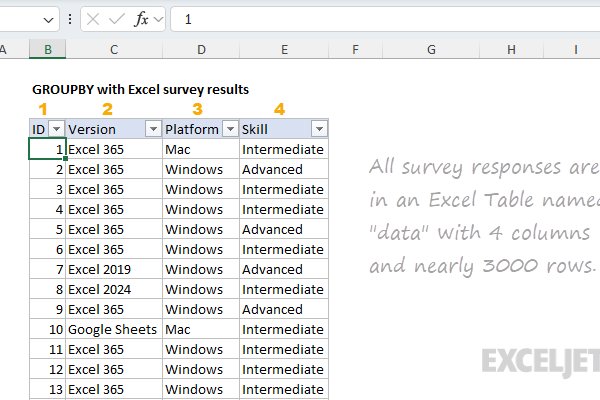

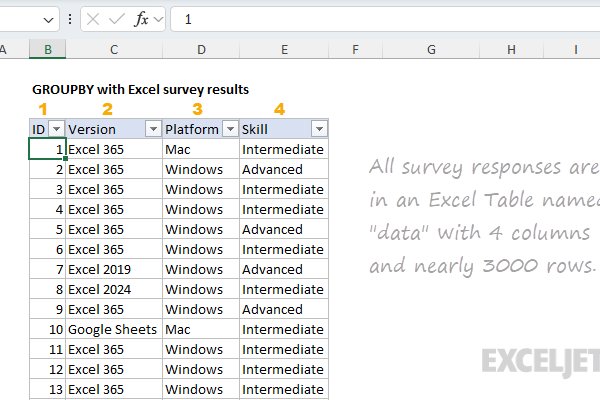
This version of the formula shows how GROUPBY can summarize survey responses by Excel version, returning a count for each group. From here, we’ll build on this structure to add percentages, custom sorting, and formatting.
Note: This is a great example of how the GROUPBY function can quickly reveal useful information. At the same time, it also demonstrates how things can get tricky when you want to calculate percentages or customize the sort order. I walk through this process in detail below. By the time we're done, we've implemented a fix for a PERCENTOF error, expanded the formula to use the LET function, added XMATCH, and the SORTBY function for sorting.